What are the Top Quality Management Tools used in an Organization?
Quality Management tools are a great tool for the organization to detect the underlying problems. Learn about the top-quality management tools that are used in the organization.

In earlier days, the company's main focus was to produce the deliveries on time, but over some time they realized that customer satisfaction and timely deliveries are not functioning together. This is when Quality Management came to take care of the importance of delivering products with services at optimal levels.
Quality Management is a set of tools utilized by an organization regardless of the size of the company, that helps them deliver the product and service with consistency and quality of time. Quality Management tools are a great assistance for the employees in an organization to examine the recurring defects, their root cause, and sub-cause, which also includes their effects on the project. Let us get started with what are the Quality Management tools used in an organization.
Importance of Quality Management Tools
According to a research publication, Quality Management is the use of management tools and techniques to achieve consistency in the quality of products and services. Quality Management tools have a lot of benefits when implemented properly. The Quality Management tool increases productivity and encourages the achievement of business goals.
Here are the importance of Quality Management tools:
- They are Cost-efficient. In a research conducted by the Center of Economic and Business Research, It was found that for every dollar invested in a quality management tool, that organization would save $16, and the profit margin is increased by $3.
- They improve the user-end satisfaction. The objective of using the tool is to improve the quality of deliveries, thereby improving the service of customers.
- They improve efficiency, Quality Management tools eliminate errors, and track the project towards progress. Through this, the organization becomes more efficient.
- They improve productivity, Since the Quality management tool eliminates the chances of making errors, it also reduces the time taken to complete the task. This keeps the team motivated and boosts productivity.
- They reduce waste. An organization incurs a lot of waste in time, energy, assets, and resources. Quality Management tools optimize the reduction of waste.
Adopting the right quality management tool saves a lot of time and resources for the company. It produces Quality deliverables and generates high ROI.
What are the top-quality management tools used in an organization?
Here is the list of top-quality management tools recommended by Kaoru Ishikawa, who has been involved in improving the quality of ideas throughout Japan.
- Fishbone Diagram
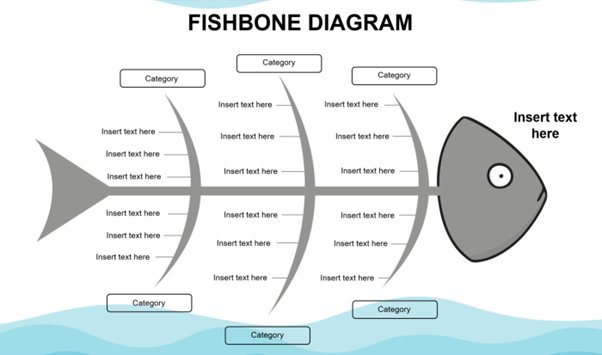
The Fishbone Diagram was created by Kaoru Ishikawa, it was created to solve problems and was introduced in the year 1945. Since the diagram represented fishbone after completion, the tool was named after it.
To design a fishbone diagram, you will need basic steps like stating the issue quickly, identifying various components, brainstorming the cause, and analyzing the diagram. The diagram is crucial in detecting the root cause of the problem and the factor responsible for it. The diagram breaks down the complex problem, the right-hand side represents the quality problems, whereas the left-hand side defines the root cause and sub-cause.
Here is the image of a modern fishbone diagram template created by Microsoft.

- Control Chart
Control Chart is primarily used to maintain the quality assurance of the product or service. It takes into consideration all the historical data to find the average/mean line of quality that is drawn on a graph. To check the type of variation, other limits are added to the chart on the upper and lower sides. Once all the variations are listed, quality management professionals find the root cause, both positive and negative, that is affecting the process. They monitor the negative variations and help the quality management team work on the variations that are to be eliminated.
- Pareto Chart
It is also known as the 80-20 rule of quality management. Most organizations presume that the problems in quality management are caused by the biggest factors. So the problems and their causes are differentiated between 80% and 20%. Pareto Chart is a combination of a line and bar graph, where the bar represents the values and the line represents the total impact. Through this, the organization gets to find its biggest problem and their cause and implement proper measures to reduce them.
- Check Sheet
It is also called the Tally sheet invented by Dr. Kaoru Ishikawa, for quality control. This tool is applicable for collecting qualitative and quantitative data. They are specifically designed to collect quantitative data. The process involved in the check sheet is that the data is collected in the form of tally marks that represent recurring specific values, which enable users to detect defects or errors within the system. It identifies the defect patterns and their cause of particular defects to manage the quality.
- Histogram
This method of identifying the root cause was introduced in 1891 by Karl Pearson. This quality management tool is a great savior for quality analysts. They analyze the different types of information that are given to different data groups to create, control, and improve the quality of the management process. The process here is that a sample is taken and divided into different groups, and the frequency of data is calculated, thereby identifying the areas of improvement in the process. In the histogram, the low-performing areas show less frequency, and this helps the quality analyst to detect the root cause and enable ways to solve it.
- Scatter Diagram
It was introduced by John F.W. Herschel in 1833 and includes scatter plots, scatter diagrams, scatter charts, or scatter graphs. Each axis represents the numerical data which is paired with one variable. The values of two numeric values are displayed through dots on the graph. By joining the dependent values on the Y-axis and independent values on the X-axis, there appears a common intersection point. If there is any correlation between the variables, dots fall along the curve. The stronger the correlation dot gets closer to the line. The relationship between the variables helps to understand the defects, causes, and their effects on the system.
- Stratification
It is the process used to divide the factors that are affecting the quality of delivery into separate groups. So the collected data is split to create and observe the patterns of factors affecting the quality. This method sorts data, objects, and people into distinct categories or layers. This is a very useful method when data needs to be analyzed to identify the source of variation for a more detailed analysis. Stratification involves dividing the data into further subgroups and that is based on criteria like time, location, or attributes.
Conclusion
Quality Management tools are the essentials that help in identifying the errors and defects, they eliminate the faults and improve the quality of the process. Quality Management tools monitor the production rate and quality, and this helps in gaining proficiency in multiple aspects, growth in career, and new opportunities.


